A team analytics project for GoExplore, a European camping & hiking retailer — and the story of how
answering it properly meant going past the brief we were actually given.
Google Sheets → BigQuery → Data StudioKNIME Analytics PlatformRandom Forest RegressionLog-Log OLS · HACGDPR-Compliant Local Stack
B
A
I
A
The Lobster Lookers — Blessy · Ayo · Iliya · Andreas — a 10-day BI project set by CEO Sabah after GoExplore's data scientist left without notice.
The Brief
Two questions, one spreadsheet, ten days
GoExplore handed us a single spreadsheet — 22,020 orders across 21 countries and 6 store types,
spanning January 2015 to July 2018 — and two business questions to answer for the CEO:
22,020
Orders analyzed
21
Countries
6
Store types
42
Months of data
🎯
Market ExpansionWhich of four candidate countries — Norway, Poland, Czech Republic, Portugal — offers the strongest revenue potential?
🏬
Retail PerformanceWhich store concepts — specialty vs. general retail — generate the most business value?
The full 10-day roadmap and all five official KPI definitions are documented in
Andreas's team blueprint.
What We Delivered to the CEO
The official pipeline: Sheets → BigQuery → Data Studio
Working entirely inside Google's ecosystem, the team turned a messy spreadsheet into a live,
filterable dashboard — the artefact Sabah actually clicked through in the final presentation.
Google Sheets
Raw data + manual GDP/population lookup
→
BigQuery
Joins, KPI queries, saved views
→
Data Studio
Interactive dashboard, filters, geo chart
The dashboard shipped five pages: revenue by country, retail performance by store type, a YoY multidimensional
revenue trend (2015–2018), a prediction-analysis view, and a final prioritized market-entry recommendation.
Dashboard 1 shows a short overview of the business questions we set out to answer: market expansion and retail performance.Dashboard 2 shows revenue generated by country.Dashboard 3 shows retail performance by store type.Dashboard 4 shows the multidimensional YoY revenue trends between 2015 and 2018.Dashboard 5 shows the prediction analysis with forecasted revenue and confidence intervals.Dashboard 6 shows the final prioritized market-entry strategy recommendation.
Why We Kept Going
Where the official pipeline hit a wall
Data Studio is a genuinely strong tool for what it's built for: turning already-computed metrics into
something a non-technical stakeholder can filter and explore in real time. What it does not do natively
is run a regression or generate a forecast — there is no modeling layer behind the charts, only aggregation.
The gap
The Prediction Analysis page needed actual forecasted revenue with confidence intervals for four markets
GoExplore had never operated in. That number doesn't exist anywhere in the raw data — it has to be modeled.
So the modeling moved outside Data Studio, into KNIME and Python, and the dashboard became the
presentation layer for numbers computed upstream rather than the place those numbers were produced.
That single gap opened into four separate technical threads, each documented as its own deep dive:
Data Engineering
GDPR-Compliant Local Stack
Rebuilt the entire Sheets → BigQuery → Data Studio chain with self-hosted, open-source tools — Postgres, Metabase, VS Code — so a European team has a zero-cloud-dependency option on the table.
Wired a visual, node-based analytics tool into the shared cloud warehouse — service account, IAM roles, JDBC driver — so modeling nodes could reach live GoExplore data with no code.
A regression pipeline on live BigQuery data, iterating from a naive linear baseline to a Random Forest model that explains two-thirds of the variance in units sold.
The number behind the dashboard's expansion recommendation: five model iterations from a broken KNIME baseline to a HAC-corrected log-log OLS with interpretable elasticities, cross-checked against a decision tree.
Combining the dashboard's retail-performance findings with the modeled revenue potential, the team's
final recommendation ranked the four candidate markets as follows:
Rank
Country
Read
1Norway
Highest revenue potential
Strong predicted performance with high confidence — GDP per capita drives the result despite a small population.
2Poland
Second-highest potential
High revenue potential backed by solid demographic and market indicators.
3Czech Republic
Strong potential
Attractive market with a positive revenue outlook and clear growth drivers.
4Portugal
Solid potential
Good revenue potential under favorable market conditions.
Exact figures were refined across several model iterations — see the
econometric deep dive
for the full log-log elasticities and per-store sensitivity analysis behind this ranking.
Flagged to the instructor
Without a real Order ID column, "one order" was approximated as a unique Date + Retailer combination —
a reasonable stand-in, but it slightly inflates Average Order Value if a store placed two orders on the
same day. Documented and disclosed rather than smoothed over.
Credit Where Due
The Lobster Lookers
This was a four-person project — everyone worked together on the practical BigQuery pipeline, with each
person also owning a piece of the delivery. The deep dives above are my individual extension on top of that
shared foundation.
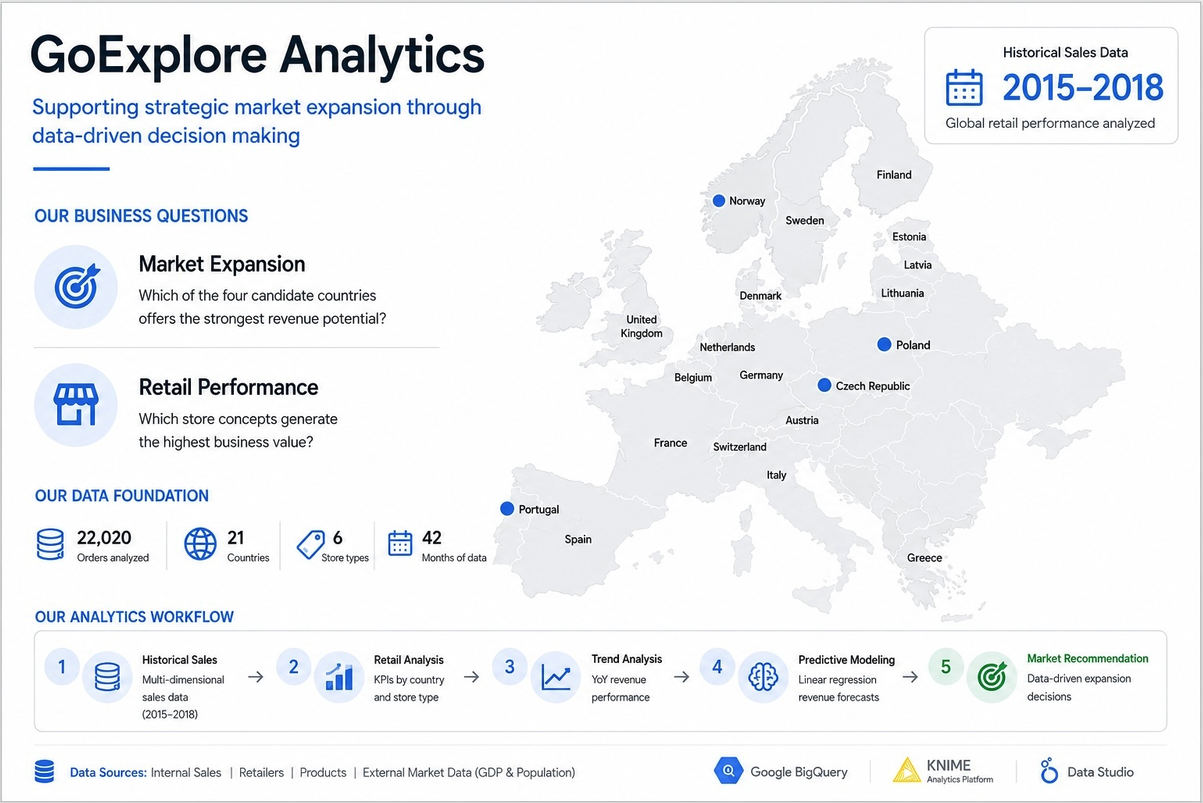 Dashboard 1 shows a short overview of the business questions we set out to answer: market expansion and retail performance.
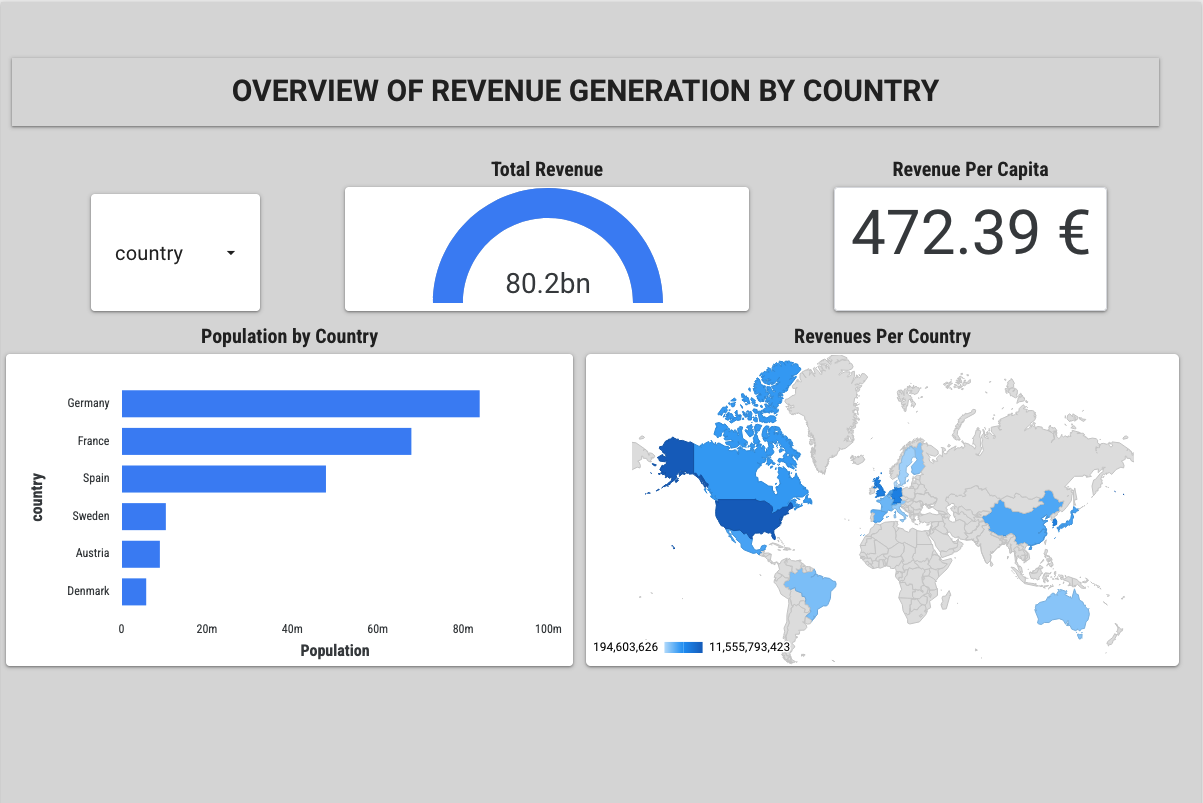 Dashboard 2 shows revenue generated by country.
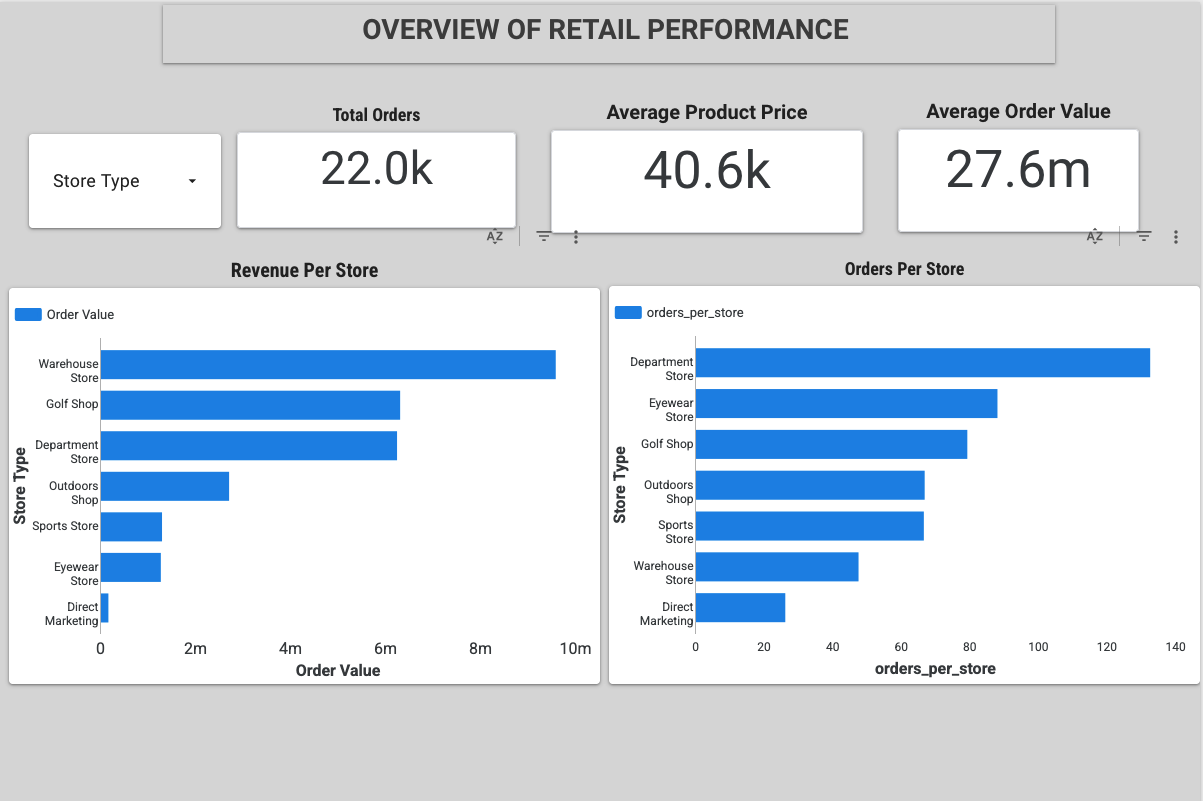 Dashboard 3 shows retail performance by store type.
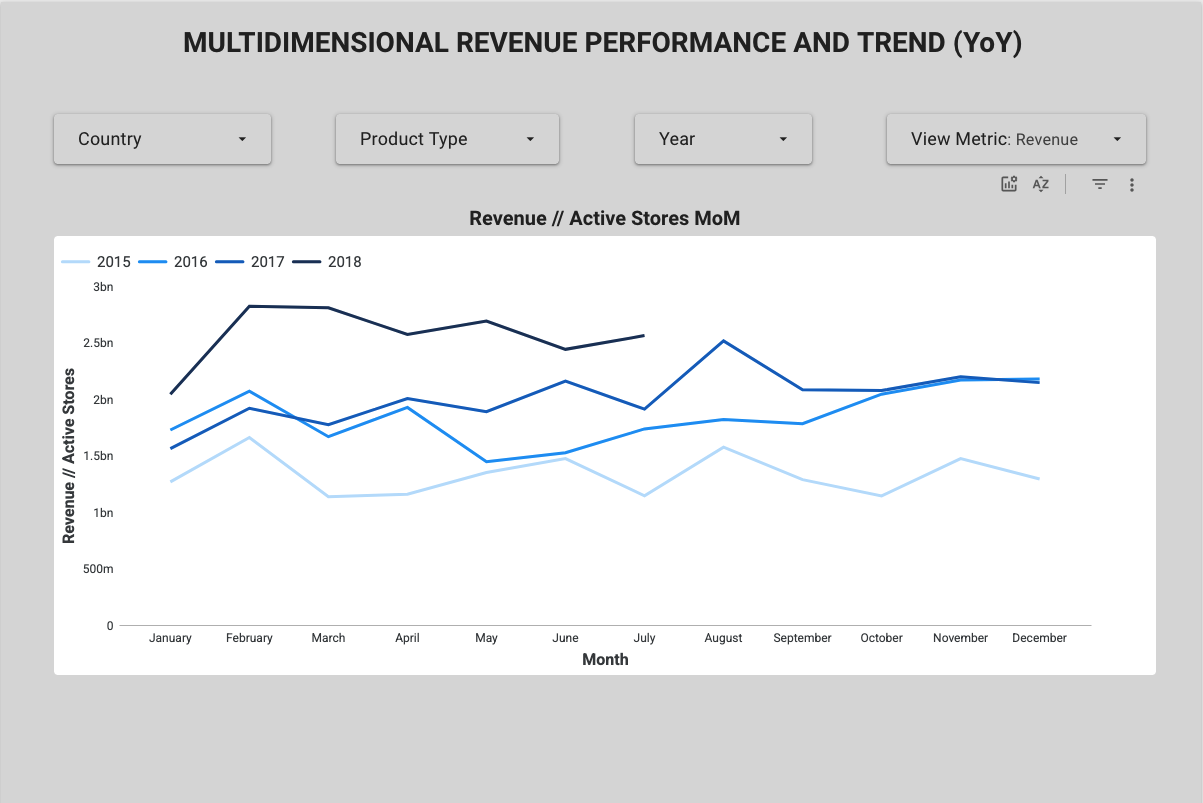 Dashboard 4 shows the multidimensional YoY revenue trends between 2015 and 2018.
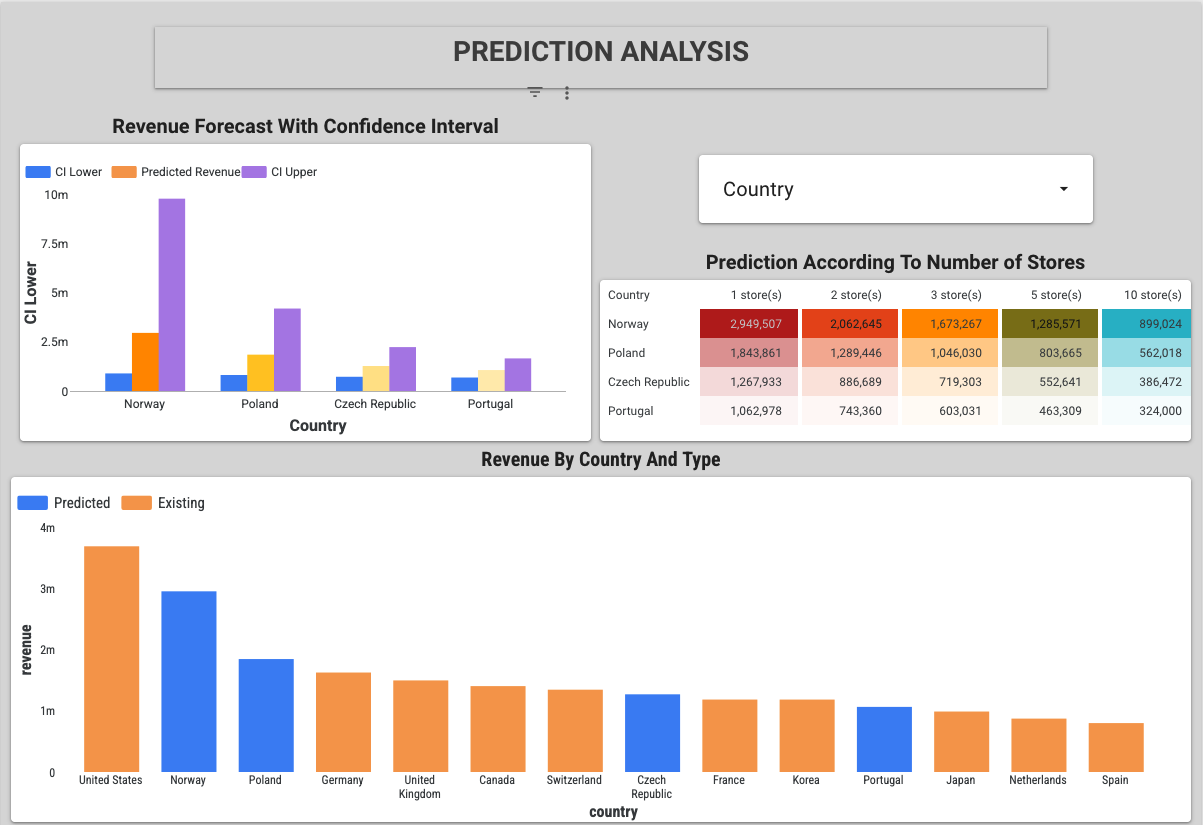 Dashboard 5 shows the prediction analysis with forecasted revenue and confidence intervals.
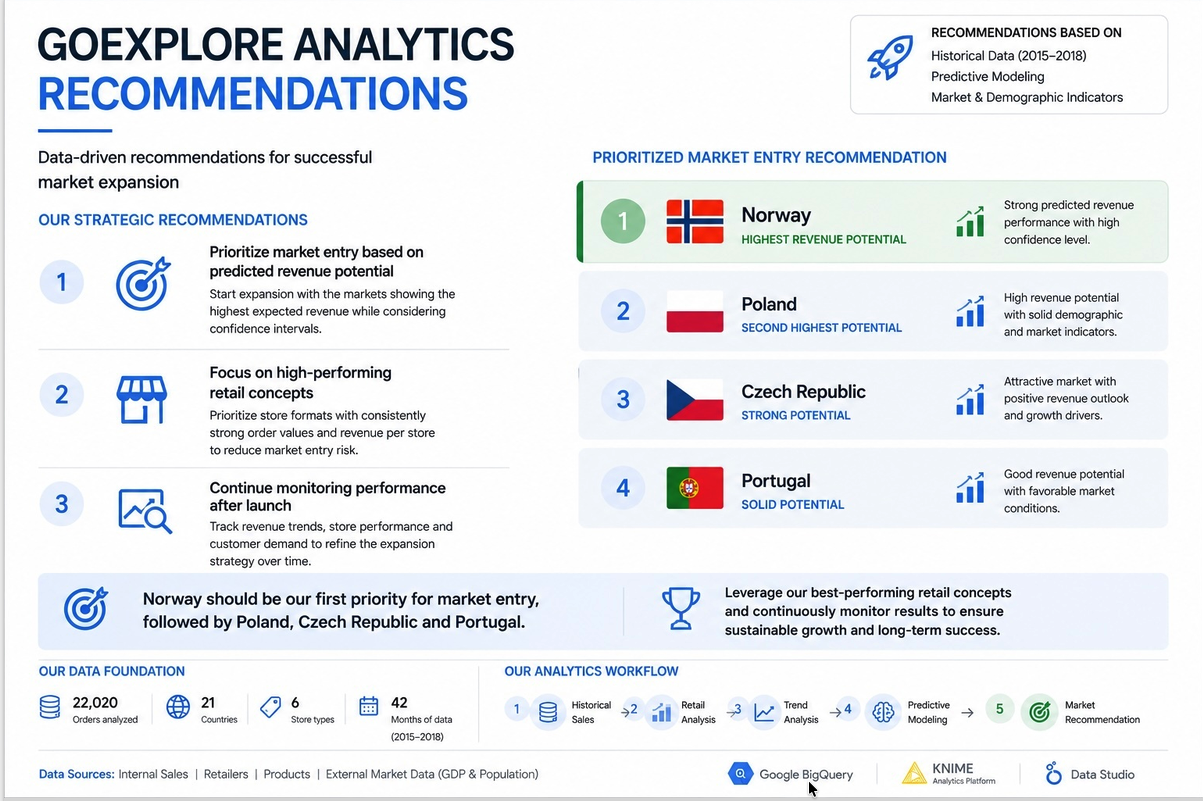 Dashboard 6 shows the final prioritized market-entry strategy recommendation.


